xtop Profiler Guide
The xtop profiler provides on-demand analysis of .xpti profile data collected by xtop run or xtop attach. It offers timeline visualization, map-level summaries, and task-level inspection.
Analysis commands (
xtop task,xtop map,xtop convert,xtop export,xtop open) do not require root privileges. On hardware,xtop runand the target process forxtop attachmay requiresudodepending on device permissions. Run standalonextop attachas the same effective user as the target (for a root target, usesudo xtop attach ...too). If the target itself must run as root, put the variable inside thesudocommand (sudo XPTI_ATTACHABLE=1 ./your_application, orXPTI_ATTACHABLE=1 sudo -E ./your_application); otherwisesudo’s defaultenv_resetstrips it and no attach socket is created.
Prerequisites
Before using the profiler, collect one or more .xpti profile files:
# Start and profile a new process
sudo xtop run -- ./your_application [args...]

# Or profile an already-running, prepared process as its owner
xtop attach --pid <PID>
These commands generate .xpti files (SQLite format). Depending on the capture interval and devices used, a profile can contain host events, device events, cache metrics, and hardware topology. For the standalone attach flow documented here, start the target with XPTI_ATTACHABLE=1; see attach mode for the exact commands.
On multi-device systems, xtop run produces one computing_..._devN.xpti file per device under ./xtop/. Devices that were not used by the application are filtered out. Commands that accept the output directory auto-pick the latest matching run profile.
Use a generated .xpti file with xtop map, xtop task, xtop convert, xtop export, or xtop open. Attach writes one file per device to ./xtop/attach_<pid>_<timestamp>/session_<sid>_dev<id>.xpti (or under the directory given with -o). Pass that .xpti file itself rather than its parent directory: directory auto-pick is non-recursive and only matches xtop run output, so xtop map ./xtop can silently analyze an older run profile instead.
Optional dependencies:
matplotlib– required forxtop map --plot(PNG plot generation)flask– required forxtop open(Perfetto UI server)
Quick Reference
| Command | Purpose | Example |
|---|---|---|
xtop convert <file> | Convert to Perfetto format | xtop convert profile.xpti |
xtop open <file> | Open in Perfetto UI | xtop open profile.xpti |
xtop export <file> | Export CSV or raw records | xtop export profile.xpti --csv ./stats_csv |
xtop map <file-or-dir> | Full execution summary | xtop map ./xtop |
xtop map <file> --plot | Generate analysis plots (PNG) | xtop map profile.xpti --plot |
xtop map <file> --json | Export analysis as JSON | xtop map profile.xpti --json |
xtop task <file> | List all tasks with timing | xtop task profile.xpti |
xtop task <file> <id> | Detailed analysis of one task | xtop task profile.xpti 17 |
Timeline Visualization
The fastest way to understand your application’s behavior is to visualize the full execution timeline in Perfetto UI.
Convert to Perfetto Format
xtop convert profile.xpti
Options:
| Option | Description | Default |
|---|---|---|
-o, --output <path> | Output file path | <input>.perfetto-trace |
--json | Generate legacy JSON format instead of protobuf | off |
--debug | Print debug information during conversion | off |
Output:
[xtop] Converting profile.xpti -> profile.perfetto-trace
[xtop] Done: 2370 host events, 4352 device events
The generated .perfetto-trace file can be opened at https://ui.perfetto.dev.
Reading the Timeline
The screenshot below shows a Perfetto timeline from a sort example (sort_with_ptr):
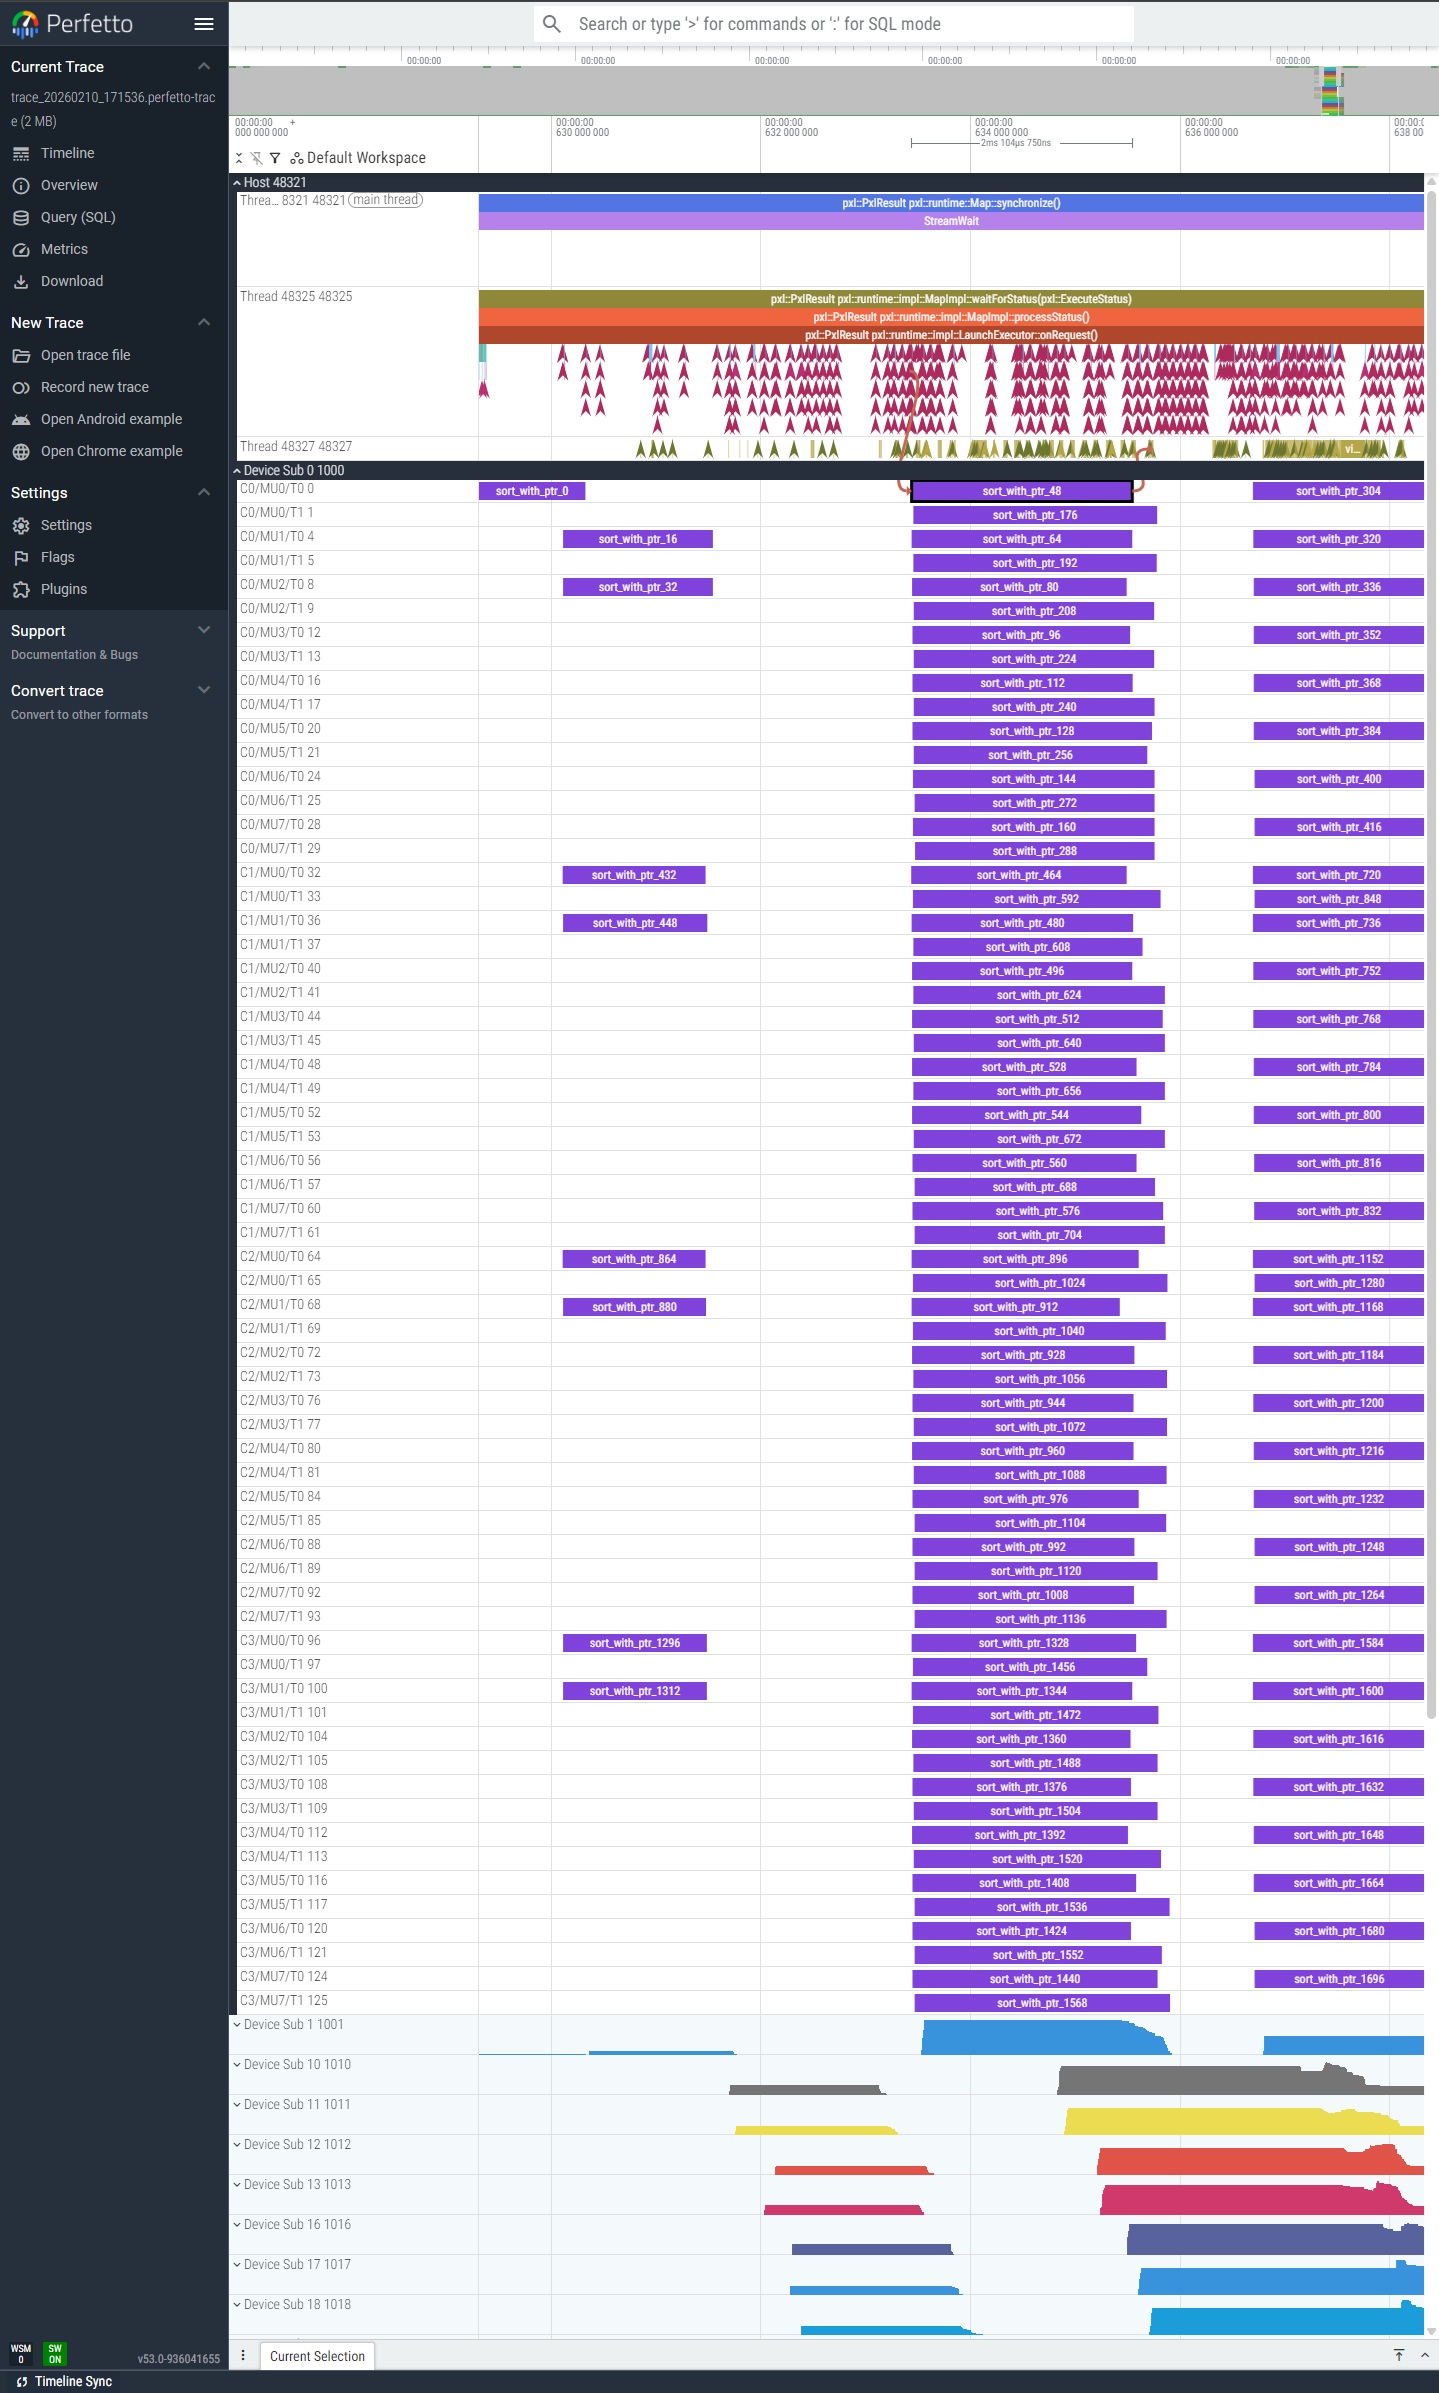
The timeline is organized into tracks:
| Track | Events | Description |
|---|---|---|
| Host | TaskDispatch / TaskComplete | Host-side API calls. Each span represents the time from dispatch to completion of a task. |
| Device | Launch / Terminate | Device-side kernel execution on each Sub/Cluster/MU/Thread. |
| Flow arrows | Host to Device | Visual connection from host dispatch to the corresponding device execution. |
What to look for:
- Gaps in host tracks indicate scheduling delays or synchronization waits.
- Uneven device track lengths suggest workload imbalance across hardware threads.
- Long flow arrows mean high overhead between host dispatch and device execution.
Open in Perfetto UI
xtop open profile.xpti
Starts a local web server and opens the trace directly in your browser, without manual upload.
Options:
| Option | Description | Default |
|---|---|---|
-p, --port <port> | HTTP server port | 8888 |
--debug | Print debug information | off |
# Open a single profile
xtop open profile.xpti

# Open a directory of traces
xtop open ./xtop/

# Use custom port
xtop open profile.perfetto-trace --port 9999
Supported file types: .xpti (auto-converts), .json, .perfetto-trace
Requires flask. Install with: pip install flask
CSV and Raw Export
Use xtop export when you need files for scripts, notebooks, or external tooling.
# Export CSV tables
xtop export profile.xpti --csv ./stats_csv

# Export raw records
xtop export profile.xpti --raw ./raw_csv

# Export both stats and raw records
xtop export profile.xpti --csv ./stats_csv --raw ./raw_csv
Layer filtering is not a user-facing option. Export all files and filter the generated CSV files downstream.
Map Analysis
Analyze the overall Map execution with parallelism, load balance, cache efficiency, and bottleneck detection. Pass either a computing .xpti file or the xtop run output directory.
Basic Summary
xtop map ./xtop
Options:
| Option | Description | Default |
|---|---|---|
--plot | Generate PNG plot with analysis charts | off |
--json | Output analysis results as JSON | off |
-o, --output <path> | Output file path (for --plot or --json) | auto |
Output:
============================================================
 MAP SUMMARY
============================================================

[Hardware]
  Subs: 2   Clusters/Sub: 2   MUs/Cluster: 4   Threads/MU: 8
  Total threads    : 128
  MU frequency     : 1100 MHz

[Duration - Host]
  Wall time        : 1,745.20 ms
  Task count       : 1,024
  avg              : 7.08 ms
  median           : 6.92 ms
  min              : 3.21 ms
  max              : 24.91 ms
  std_dev          : 2.34 ms

[Duration - Device]
  Task count       : 1,024
  avg              : 6.55 ms
  median           : 6.40 ms
  min              : 2.98 ms
  max              : 23.12 ms
  std_dev          : 2.10 ms

[Parallelism - Host]
  max_concurrent   : 128
  avg_concurrent   : 95.3
  ramp_up          : 45.23 ms
  max_hold         : 1,610.74 ms
  ramp_down        : 89.23 ms

[Parallelism - Device]
  max_concurrent   : 128
  avg_concurrent   : 94.5
  ramp_up          : 48.90 ms
  max_hold         : 1,605.64 ms
  ramp_down        : 90.66 ms

[Skew] (Sub/Cluster distribution)
  Sub0             : ######### 52%
  Sub1             : ######## 48%
  balance_score    : 0.96 (1.0 = perfectly even)

[Overhead] (scheduling + communication)
  avg_overhead     : 0.53 ms
  p95_overhead     : 1.82 ms
  max_overhead     : 6.41 ms

[Cache]
  L1 hit rate      : 92.1% (r:95.0% w:88.0%)
  L2 hit rate      : 74.3%
  L3 hit rate      : 88.9%

[Memory Bandwidth] (estimated from L3)
  read commands    : 50,000
  write commands   : 30,000
  cache line size  : 64 bytes
  time span        : 1,745.20 ms
  estimated BW     : 2.93 GB/s

[Stragglers]
  straggler_ratio  : 1.23x (1.0 = even, >2.0 = imbalanced)
  Top busy:
    sub=0 cluster=0 mu=0 thread=0   120 tasks, avg 7.25 ms
    sub=1 cluster=1 mu=2 thread=3   115 tasks, avg 7.18 ms
  Least busy:
    sub=0 cluster=1 mu=3 thread=7    95 tasks, avg 6.80 ms

[Idle]
  total_idle       : 12.34 ms
  total_active     : 1,732.86 ms
  idle_percentage  : 0.7%

[Utilization]
  active_threads   : 128 / 128 (100.0%)
  total_tasks      : 1,024

============================================================
Sections explained:
| Section | What it tells you |
|---|---|
| Hardware | Device topology and clock frequency from profile metadata. |
| Duration | Task execution time statistics from both host and device perspectives. Large gap between Host and Device averages indicates high scheduling overhead. |
| Parallelism | How many tasks run concurrently over time. Ramp-up is time to reach peak concurrency; ramp-down is time from peak to completion. Long ramp-down suggests stragglers. |
| Skew | Task distribution across Subs and Clusters. A balance score close to 1.0 means work is evenly distributed. |
| Overhead | Difference between host-measured and device-measured task duration. Includes scheduling latency, driver communication, and queue wait time. |
| Cache | Aggregate cache hit rates. Low L2 hit rate may indicate poor data locality. |
| Memory Bandwidth | Estimated from L3 cache command counts and cache line size. This is an approximation, not precise measurement. |
| Stragglers | Threads with disproportionately high or low workload. A straggler ratio above 2.0 indicates significant imbalance. |
| Idle | Time gaps between consecutive tasks on each thread. High idle percentage suggests underutilization. |
| Utilization | Fraction of hardware threads that received at least one task. |
Generate Plots
xtop map profile.xpti --plot -o analysis.png
Generates a multi-panel PNG image for visual analysis. The screenshot below shows the plot output from a sort example:
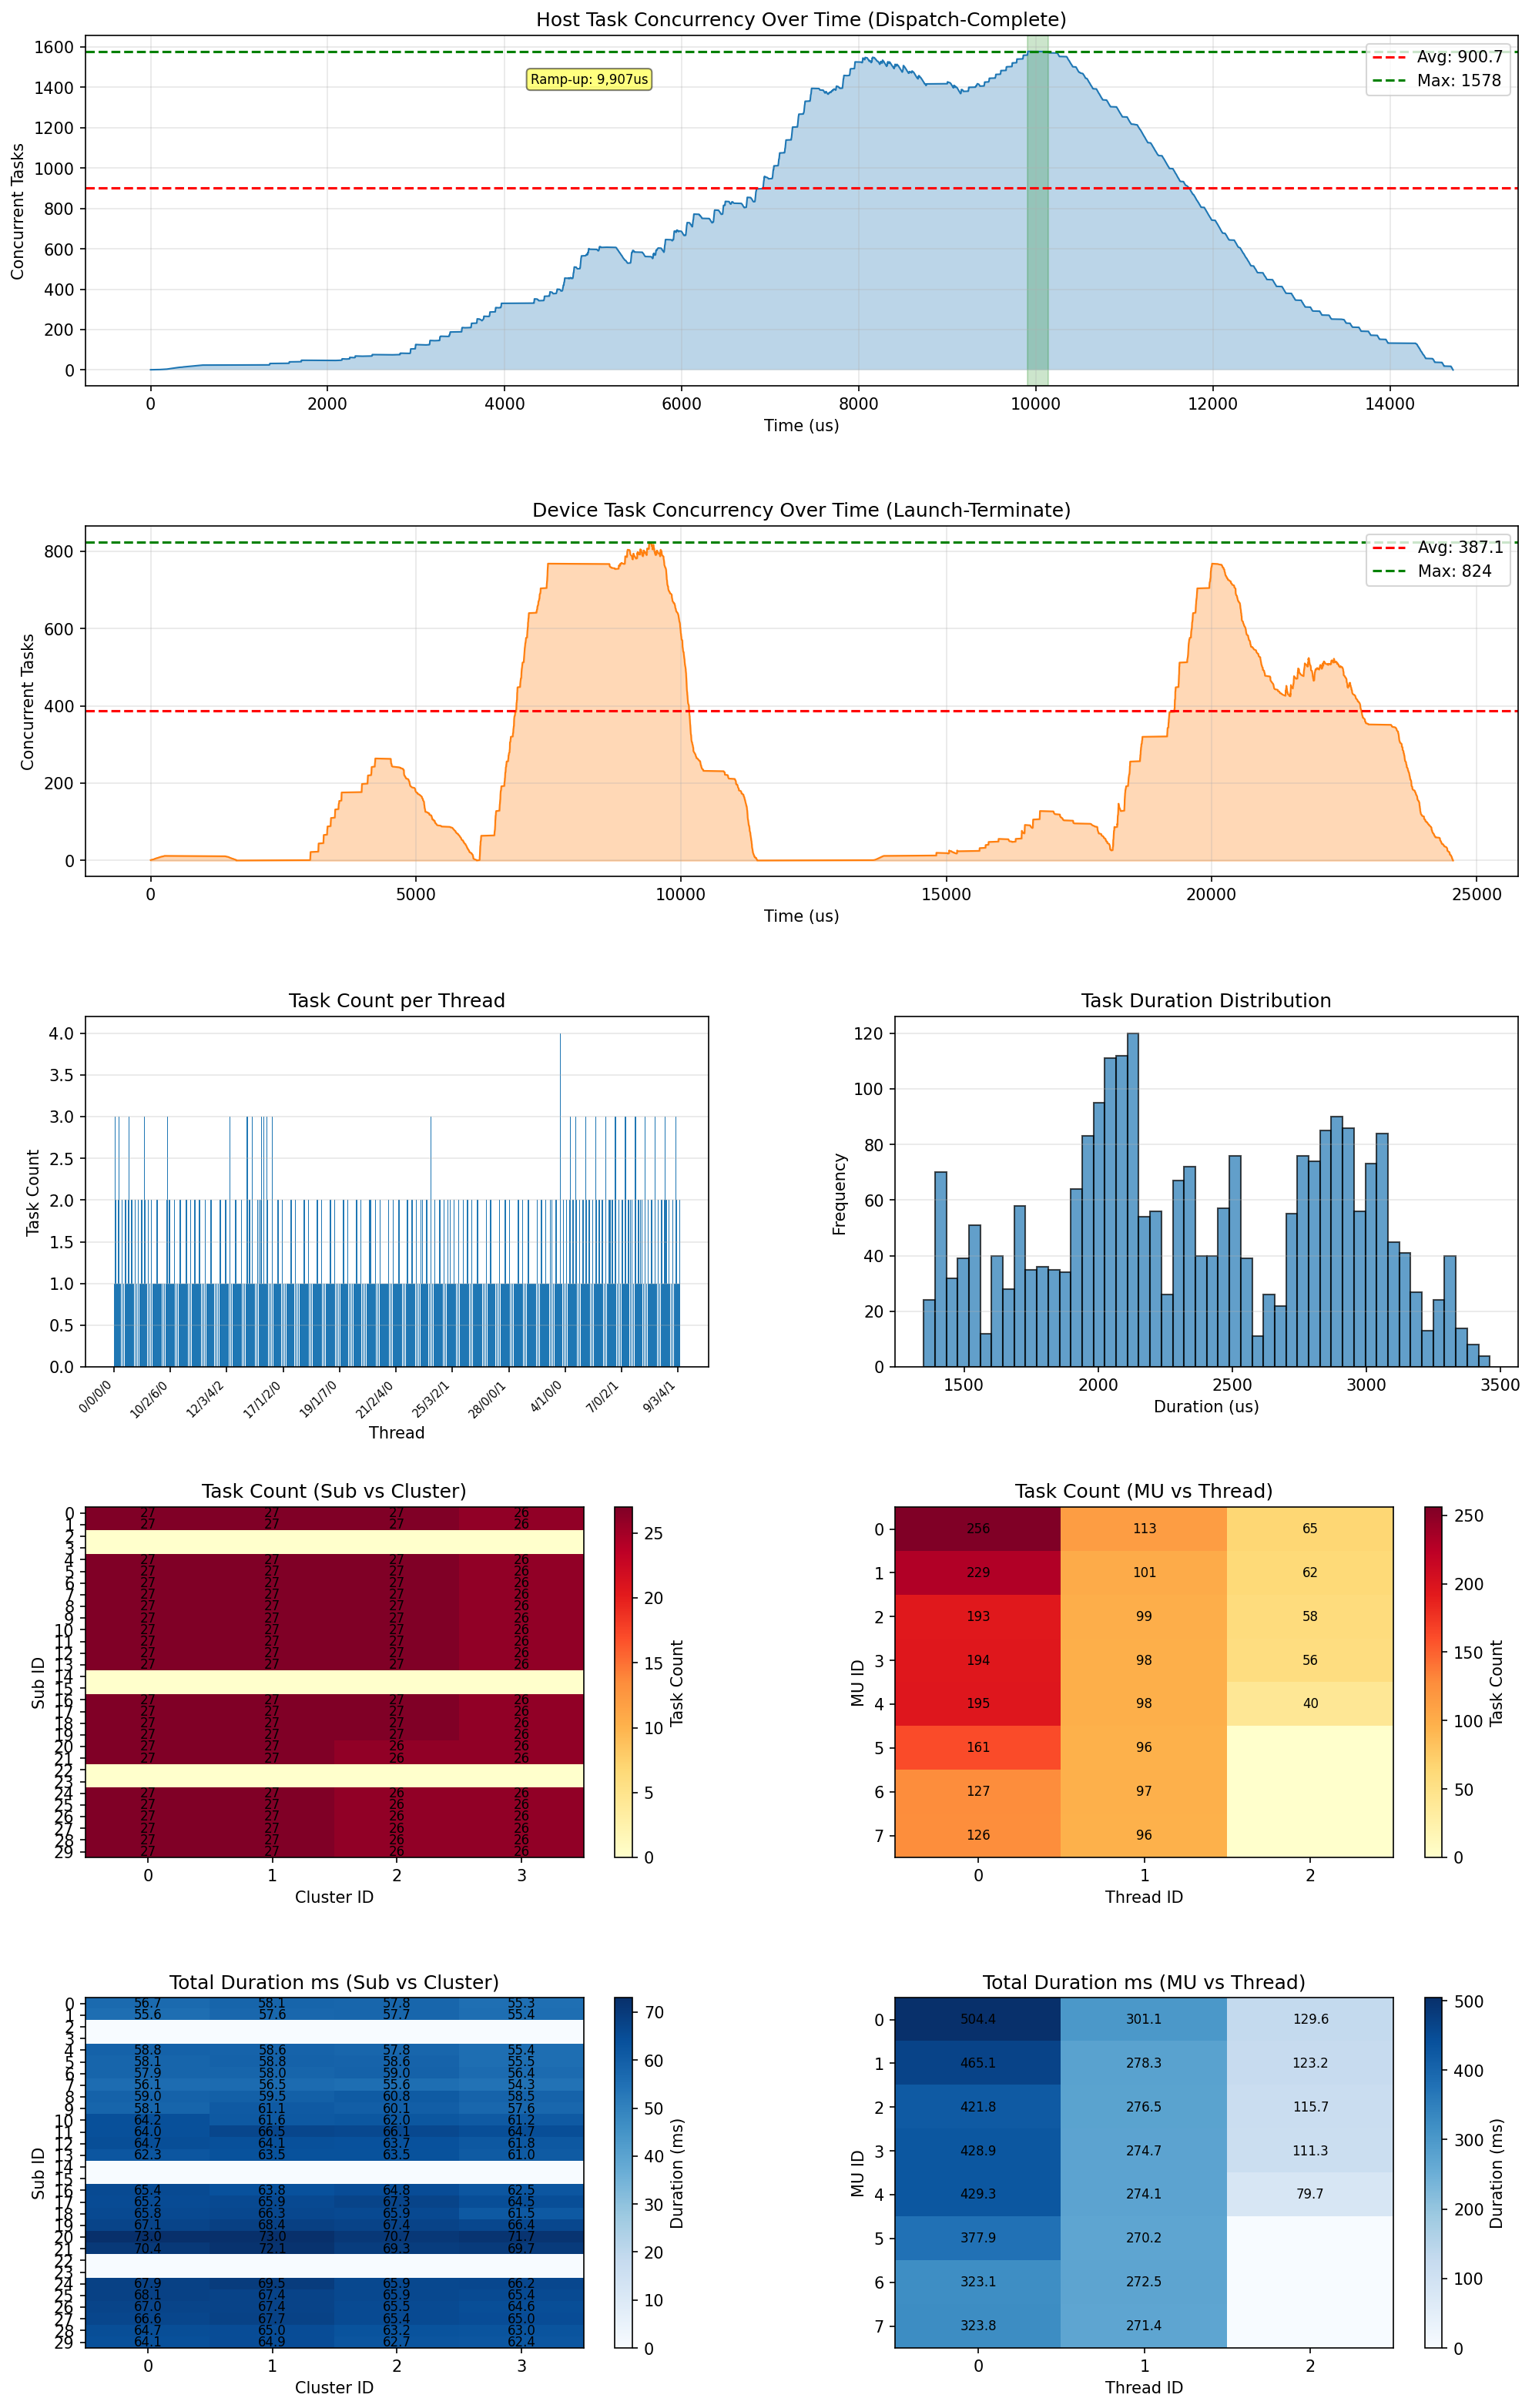
The plot contains 8 panels:
| Panel | Description |
|---|---|
| Host concurrency over time | Number of concurrent host tasks (Dispatch-Complete) at each point in time. The red dashed line shows peak concurrency. |
| Device concurrency over time | Number of concurrent device tasks (Launch-Terminate). Compare with host concurrency to spot scheduling overhead. |
| Task count per thread | Bar chart showing how many tasks each hardware thread executed. Even bars indicate good load balance. |
| Duration histogram | Distribution of individual task execution times. A long tail indicates straggler tasks. |
| Sub/Cluster task count heatmap | Task count distribution across the Sub x Cluster grid. Darker cells received more tasks. |
| MU/Thread task count heatmap | Task count distribution across the MU x Thread grid. |
| Sub/Cluster duration heatmap | Total execution time per Sub x Cluster combination. Uneven colors indicate workload imbalance. |
| MU/Thread duration heatmap | Total execution time per MU x Thread combination. |
Requires matplotlib. Install with: pip install matplotlib
Export as JSON
xtop map profile.xpti --json -o analysis.json
Exports the full analysis result as a JSON file for programmatic consumption or integration with other tools.
Task Analysis
Inspect individual task execution timing, hardware placement, and per-task cache statistics from a computing profile.
List All Tasks
xtop task profile.xpti
Options:
| Option | Description | Default |
|---|---|---|
--sort {id,active,overhead} | Sort order | id |
--filter <expr> | Filter tasks (e.g., sub=0, cluster=1) | none |
--limit N | Limit number of rows | all |
Output:
========================================================
 TASK LIST
========================================================

 ID     Kernel           Active       Overhead     Sub    Cluster
------  -------          -------      -------      ---    -------
 0      sort_kernel      7.08 ms      1.52 ms      0      0
 1      sort_kernel      6.92 ms      0.12 ms      0      1
 2      sort_kernel      8.21 ms      3.41 ms      1      0
 ...
------
 Total: 1024 tasks
Columns explained:
| Column | Description |
|---|---|
| ID | Task index (assigned at dispatch) |
| Kernel | Kernel function name |
| Active | Device execution time (Launch to Terminate) |
| Overhead | Host duration minus device active time (scheduling + communication) |
| Sub | Sub where the task executed |
| Cluster | Cluster where the task executed |
Examples:
# Sort by longest execution time
xtop task profile.xpti --sort active

# Show only tasks on Sub 0
xtop task profile.xpti --filter sub=0

# Top 10 slowest tasks
xtop task profile.xpti --sort active --limit 10
Task Detail
xtop task profile.xpti 17
Shows comprehensive timing breakdown, hardware placement, cache statistics, and diagnostic messages for a single task.
Output:
============================================================
 Task 17 (kernel: sort_kernel)
============================================================

[Timing]
  dispatch(host)  : 12384 us
  complete(host)  : 24118 us
  host_duration   : 11.73 ms

  launch(device)  : 500 ticks
  terminate       : 9942 ticks
  active_time     : 9.44 ms

  overhead        : 2.29 ms (19.5%)

[Placement]
  sub / cluster / mu / thread
  0 / 0 / 3 / 2

[Cache] (task time window)
  L1 hit   : 92.1% (512 samples)
  L2 hit   : 74.3% (256 samples)
  L3 hit   : 88.9% (64 samples)

[Diagnosis]
  ! High overhead (19.5% of host duration)
  ! L2 miss rate above threshold
Sections explained:
| Section | Description |
|---|---|
| Timing | Host-side timestamps (dispatch/complete) and device-side timestamps (launch/terminate). Overhead = host_duration - active_time. |
| Placement | Which Sub/Cluster/MU/Thread executed this task. |
| Cache | L1/L2/L3 hit rates during the task’s time window. Sample count indicates data availability. |
| Diagnosis | Automated warnings: high overhead, low cache hit rates, or other anomalies. |
Typical Workflow
A common profiling workflow:
# 1. Collect profile data
sudo xtop run -- ./my_application

# 2. Quick overview. Directory input auto-picks the latest computing profile.
xtop map ./xtop

# 3. Visualize the full timeline
xtop open ./xtop/computing_20260210_143022_123456_dev0.xpti

# 4. Identify slow tasks
xtop task ./xtop/computing_20260210_143022_123456_dev0.xpti --sort active --limit 10

# 5. Export CSV if needed
xtop export ./xtop/computing_20260210_143022_123456_dev0.xpti --csv ./stats_csv
What to Look For
| Symptom | Where to check | Possible cause |
|---|---|---|
| Long wall time | xtop map Duration section | Too few tasks, or stragglers |
| High overhead | xtop map Overhead section | Scheduling bottleneck |
| Uneven distribution | xtop map Skew / Stragglers | Data-dependent workload imbalance |
| Low cache hit rate | xtop map Cache section | Poor data locality |
| Long ramp-down | xtop map Parallelism section | Straggler tasks holding up completion |
| Individual slow task | xtop task <file> <id> | Cache misses, large data set |